System_Log.md 2.2 KB
System Log
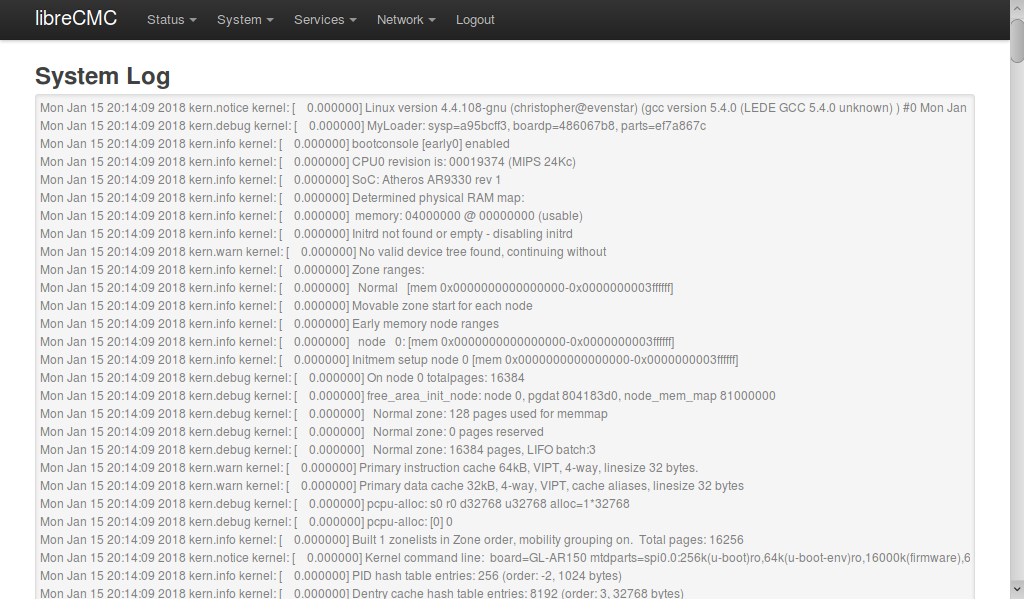
Viewing the system log from LuCi
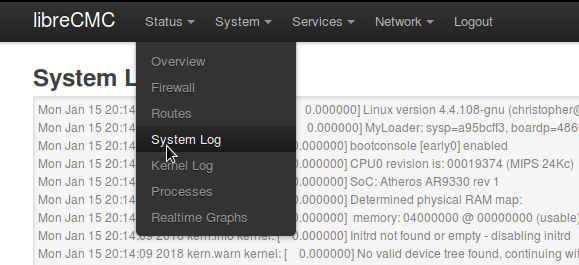
Select the Status >> System Log menu entry.
The System Log page in LuCi does not have an interface for filtering
output. Therefore, you will likely want to use the shell interface.
Viewing the system log from the shell
Once logged in via SSH, use the logread command
Usage: logread [options]
Options:
    -s <path>		Path to ubus socket
    -l	<count>		Got only the last 'count' messages
    -e	<pattern>	Filter messages with a regexp
    -r	<server> <port>	Stream message to a server
    -F	<file>		Log file
    -S	<bytes>		Log size
    -p	<file>		PID file
    -h	<hostname>	Add hostname to the message
    -P	<prefix>	Prefix custom text to streamed messages
    -f			Follow log messages
    -u			Use UDP as the protocol
    -t			Add an extra timestamp
    -0			Use \0 instead of \n as trailer when using TCP
For example:
root@libreCMC:~$ logread | grep 'kern\.warn'
Mon Jan 15 20:22:01 2018 kern.warn kernel: [    0.000000] No valid device tree found, continuing without
Mon Jan 15 20:22:01 2018 kern.warn kernel: [    0.000000] Primary instruction cache 64kB, VIPT, 4-way, linesize 32 bytes.
Mon Jan 15 20:22:01 2018 kern.warn kernel: [    0.000000] Primary data cache 32kB, 4-way, VIPT, cache aliases, linesize 32 bytes
Mon Jan 15 20:22:01 2018 kern.warn kernel: [    0.669305] Crashlog allocated RAM at address 0x3f00000
Mon Jan 15 20:22:01 2018 kern.warn kernel: [    0.752178] m25p80 spi0.0: found mx25l12805d, expected m25p80
One should be able to use logread -e instead of grep, but it seems
that not all the same regular expressions work for both:
root@libreCMC:~$ logread -e 'kern\.warn' # and other similar variations
(no output)
The system log is contained in a limited size, circular buffer in memory. So, if you have some process writing messages periodically, this will eventually erase messages that were only written once.
Configuring the system log
TODO
Monitoring the system log
TODO

